While on the forums I noticed a lot of people are having trouble diagnosing delta issues, so I created this post to help others.
Edit: We've made a YouTube tutorial.
I implore you watch this video:
Here's how I diagnose issues on my deltas:
Step 1. Create a TestProbe Macro
Create a new macro, I label it as "TestProbe" and copy this code:
G30 P0 X0 Y125 Z-99999
G30 P1 X108.24 Y62.5 Z-99999
G30 P2 X108.24 Y-62.5 Z-99999
G30 P3 X0 Y-125 Z-99999
G30 P4 X-108.24 Y-62.5 Z-99999
G30 P5 X-108.24 Y62.5 Z-99999
G30 P6 X0 Y62.5 Z-99999
G30 P7 X54.13 Y-31.25 Z-99999
G30 P8 X-54.13 Y-31.25 Z-99999
G30 P9 X0 Y0 Z-99999 S-1
G0 Z250 ; When done go to z250
Note: you may want to switch the G0 Z250 line if your max height is less than 250 mm.
Step 2: Run Probe
Run the probe and the g-console will return a M98 "....[MacroName]" along with 10 probed heights.
Step 3: Analysis
Download this excel sheet (Used in the blog post).
Download the new excel sheet with 10 and 13 points (used in the YouTube).
Link to the Graphing Application ( Grapher) used in the YouTube.

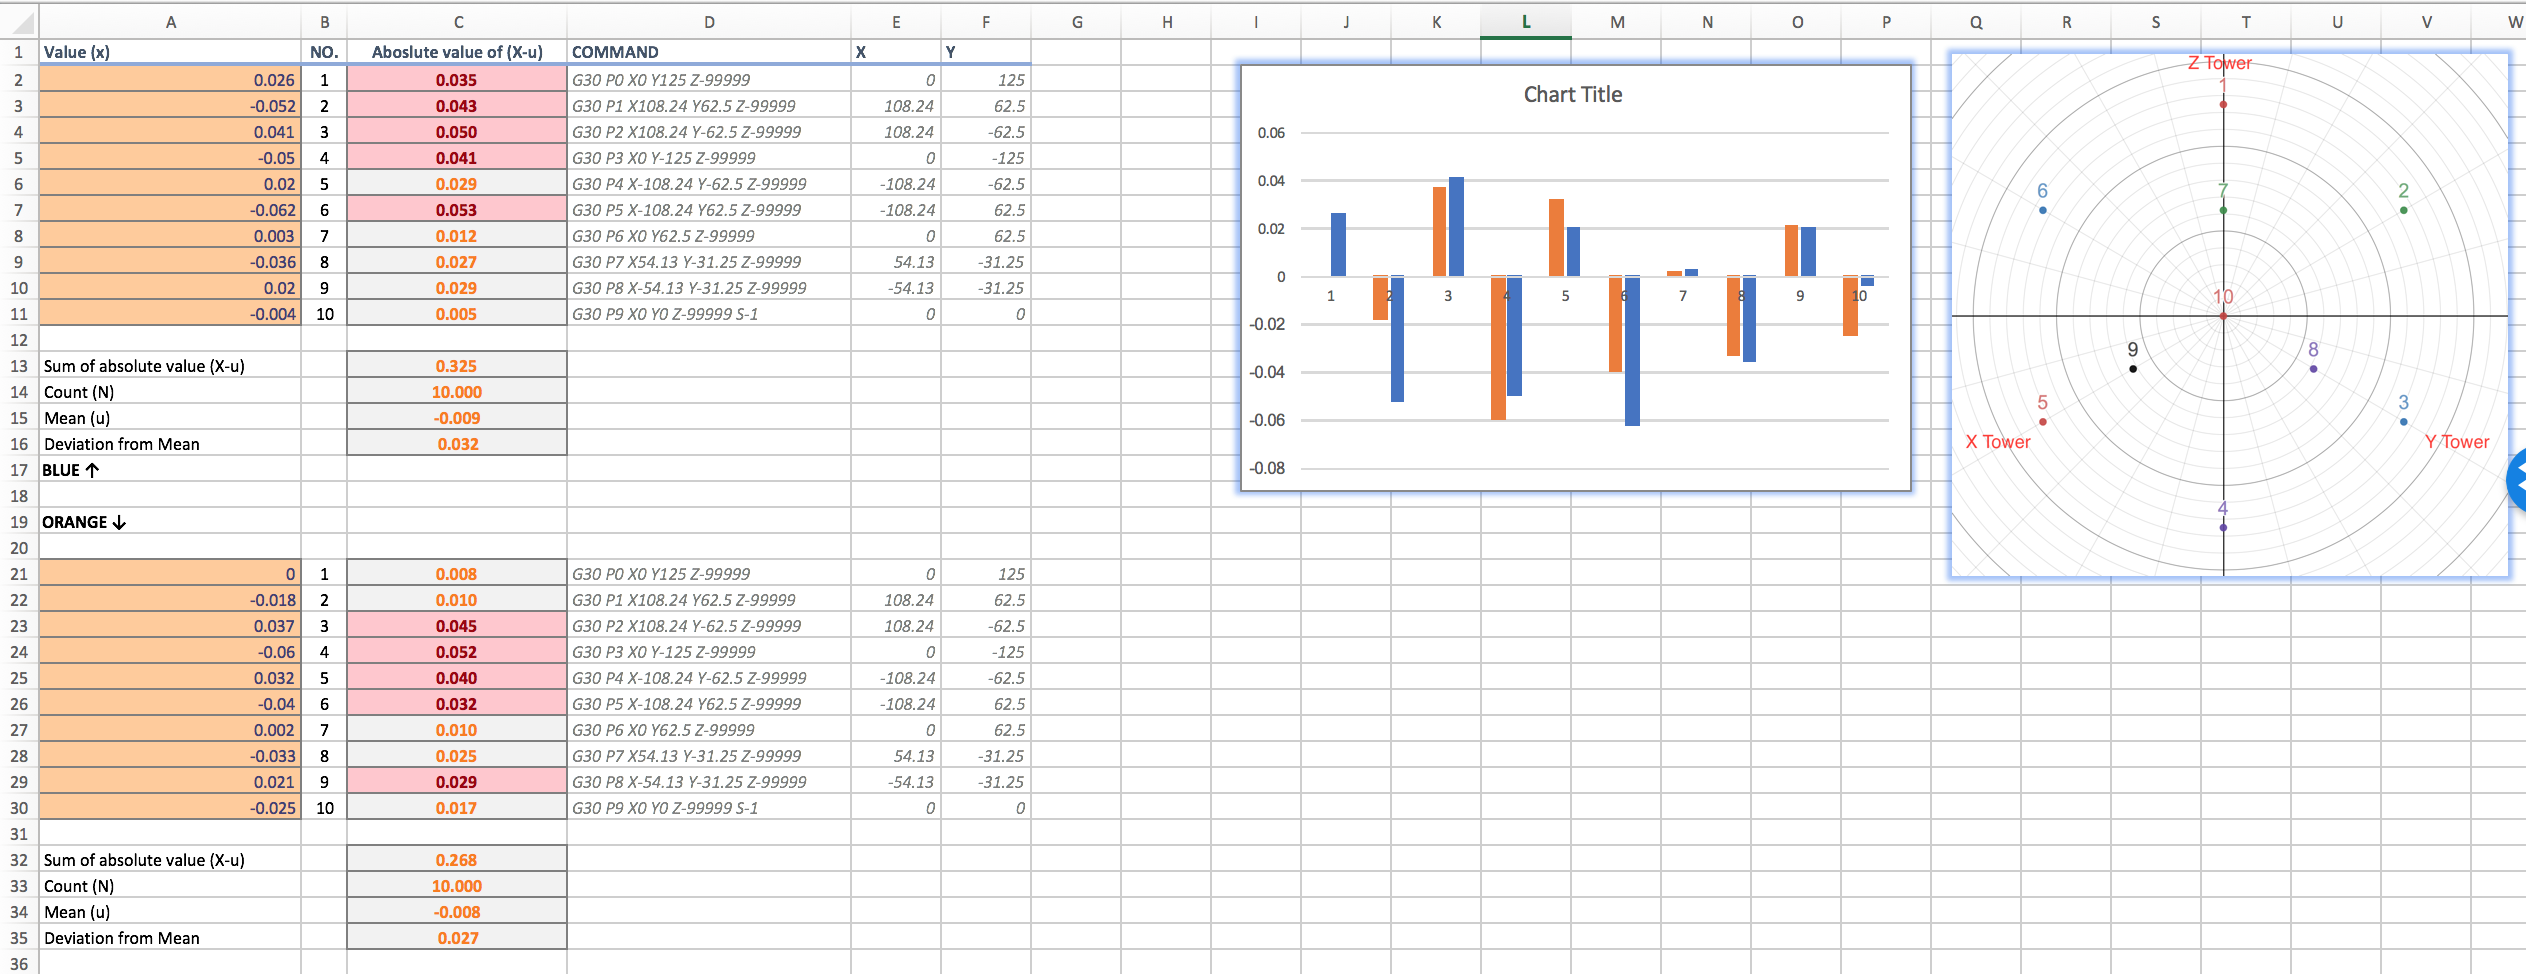
Note: There are two datasets shown so that you can compare before and after changes.
Note: The first dataset will show up as blue columns, and the second dataset will show up as orange columns in the chart.
The probed heights from the macro go into Column A (Value). The values of importance are the Mean and Deviation from mean. For delta printers, a deviation from mean of <.04 is optimal.
Column C (Absolute Value of X-u) will automatically highlight values greater than the mean. These are the data points we're interested in.
Note: Points 1 and 4 will strongly correlate with the Z tower. Points 3 and 6 will strongly correlate to the Y tower. Points 2 and 5 will strongly correlate to the X tower.
The exercise:
With dataset 1, points 1:4 and 6 are above the mean.
- What does this mean?
Looking at the coordinate map we should take a closer look at towers Z and Y. The highest points correlate to Tower Y, so I would begin starting here.
- What does this entail?
- Binding: Ensure your carriages are moving freely without any binding (drag). If there is binding take a closer look at your belts and ensure they're aligned properly. Look at your stepper and idler pulleys to ensure they're secured.
- Belt tension: ensure all of the belts are around the same tension. If you can, you can use an app called EasyTension on your phone to use the phones' microphone to determine tension in Hz.
Note: Adjust one tower at a time. So with dataset 1 I would look at the Y tower, adjust, run g32, then redo the probe.
Tip: After changing anything I run this macro:
Update as of Duet V2.03beta2 2/19/19, new macro:
;G32 till it converges usually 3x is fine
G32 ; AutoCal
G32
G32
G32
G32
M500 ; save to override file
M665 ; generate the delta configuration output
M666 ; generate the delta endstop adjustment output
G0 Z5 ; go to z = 5
G30 S-3 ; probe the bed and then z probe
M500 P30 ; save the value to the override file.
;transfer M665, M666, Z probe values to config.g
Dataset 2 exists to compare if the change we did was significant or if there are issues still present. In this scenario I adjusted the Z tower first as I noted some binding. We see that in dataset 2, there still are issues present in the Y tower (points 3 and 6).
Points 7:10 are more difficult to diagnose as they correspond to multiple towers.
Keep repeating the process till the deviation and bed mapping are to your satisfaction.


